This is the second of five articles that discuss the various approaches to measuring credit risk in a portfolio. This article covers CreditPortfolio view. CreditPortfolio View is conceptually not too dissimilar from the Credit Metrics model described earlier, ie it relies upon a knowledge of the transition matrices between the different credit ratings. The only difference is that the transition matrix itself has an adjustment applied to it for the business cycle. But once this adjusted transition matrix has been obtained, the rest of the process works in the same way as for the Credit Metrics model.
CreditPortfolio View is based upon the argument that default and migration probabilities are not independent of the business cycle. The ‘unconditional’ migration matrix needs to be adjusted for the state of the economy and the business cycle. This is understandable as during boom times default probabilities run at lower than the long term average that is reflected in the ‘unconditional’ migration matrix; and conversely during recessions default probabilities and downward migration probabilities run lower than the longer term average. This effect is more amplified for speculative grade credits than for investment grade as the latter are more stable even in tougher economic situations.
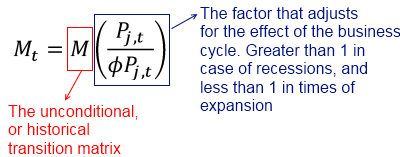
This adjustment to the migration matrix is done by multiplying the unconditional migration matrix by a ‘factor’ that reflects the state of the economy.
If M be the unconditional transition matrix, then M x Factor is the Conditional transition matrix. How do we derive the ‘factor’?
The factor is just the conditional probability of default in period t divided by the unconditional (or historical) probability of default in the same period. This is expressed as follows:![]()
Where M is the unconditional transition matrix, and Pj,t is the conditional probability of default in period t, and ϕPj,t is the unconditional probability of default in period t. (Consider the entire expression to be one variable, not a product of ϕ and Pj,t .).

Now Pj,t itself is a logit function – and these have the useful property that their value varies between 0 and 1 – exactly what we need for something to be a probability.![]()
Here, Yj,t is an index value derived using a multi-factor regression model that considers a number of macro economic factors, j representing the industry and t the time period. Pj,t varies between 0 and 1, and represents the probability of default for speculative grade issuers.
Using simulation, one can generate values of Pj,t over a multi-period horizon, apply it to the historical transition matrix from the rating agencies, and simulate the value of the credit portfolio to calculate the bottom 5th or 1st percentile.
The exact mathematics and mechanics of the above are beyond the scope of the handbook – understanding the above conceptually should suffice.
